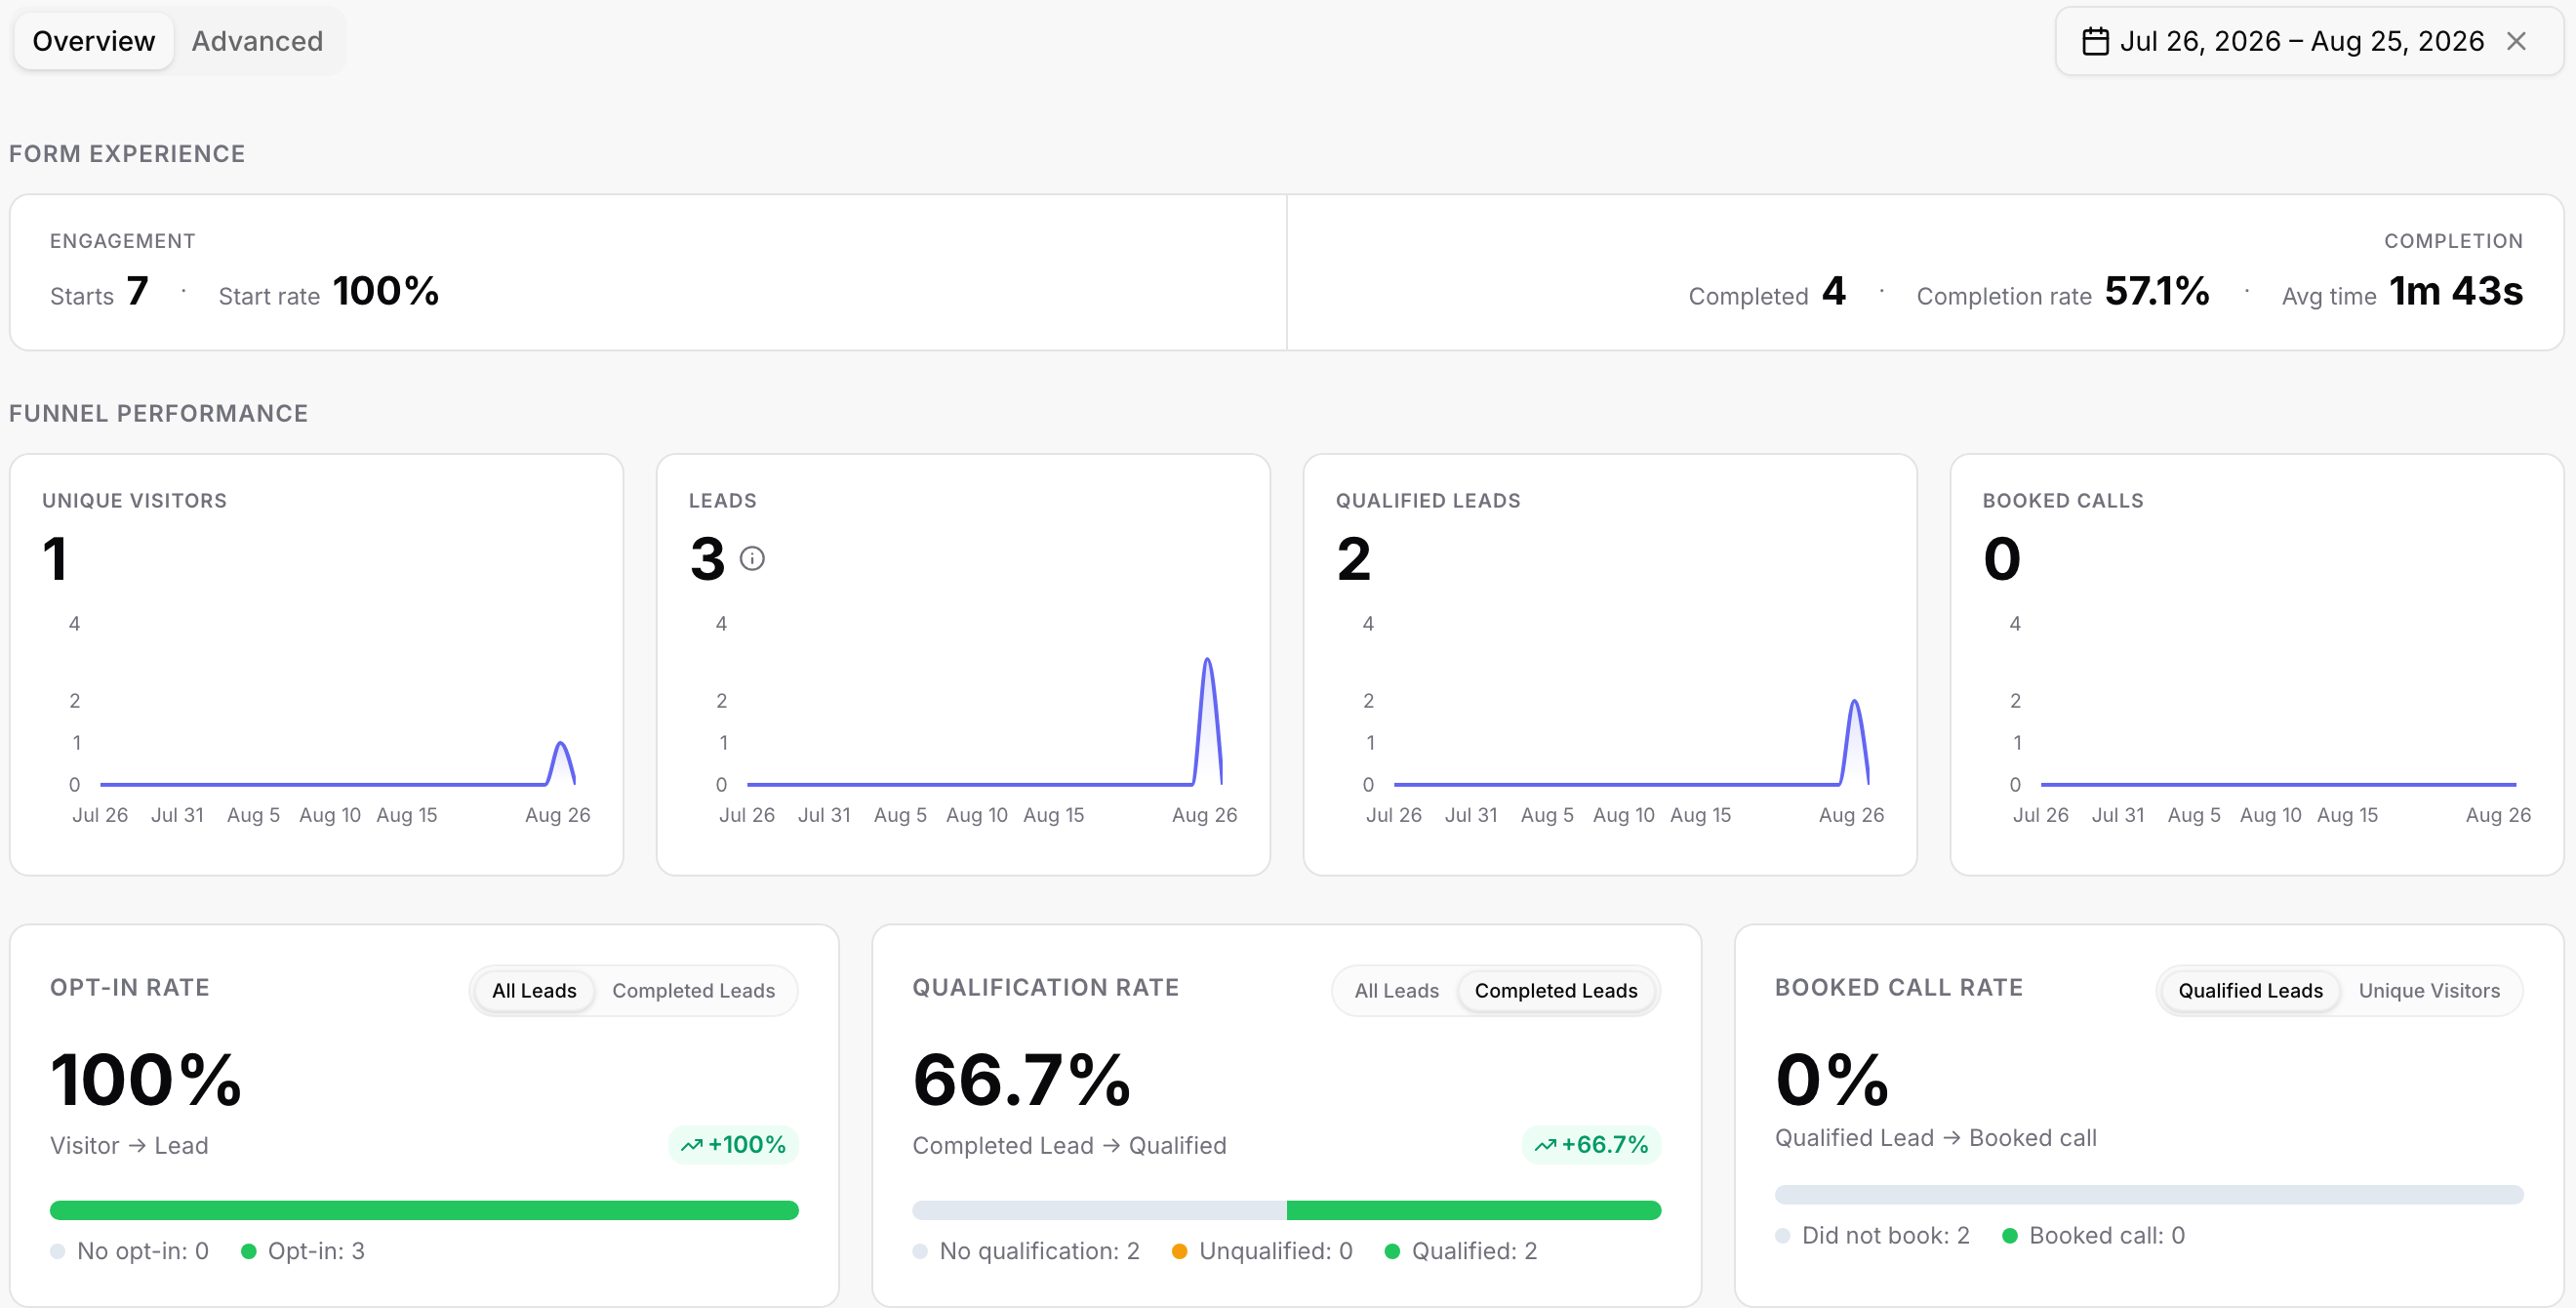
Open a form and click Analytics in the top bar. The tab has two views, Overview and Advanced, and a date range picker in the top right. The default range is the last 30 days; click the x on it to switch to All Time, or pick any range on the calendar. Every number on the page follows the range.
Starts and Start rate: how many visitors began the form (answered the first question or passed the intro), and what share of unique visitors that is.
Completed and Completion rate: how many reached an ending, and what share of starters that is.
Avg time: the average time from start to completion.
Four cards, each with a daily sparkline: Unique Visitors, Leads (visitors who left an email or phone, including partial submissions), Qualified Leads (reached an ending marked Qualified), and Booked Calls (booked through a Calendar ending). Read them left to right and you have your funnel.
Opt-in Rate (Visitor to Lead): the share of unique visitors who became a lead. Toggle between All Leads and Completed Leads to include or exclude partials.
Qualification Rate (Completed Lead to Qualified): the share of leads that reached a Qualified ending, with a breakdown of No qualification, Unqualified, and Qualified.
Booked Call Rate (Qualified Lead to Booked call): the share of qualified leads who booked. Switch the denominator to Unique Visitors to see the end-to-end rate.
The small green or red badge on a rate card compares it to the previous period of the same length.
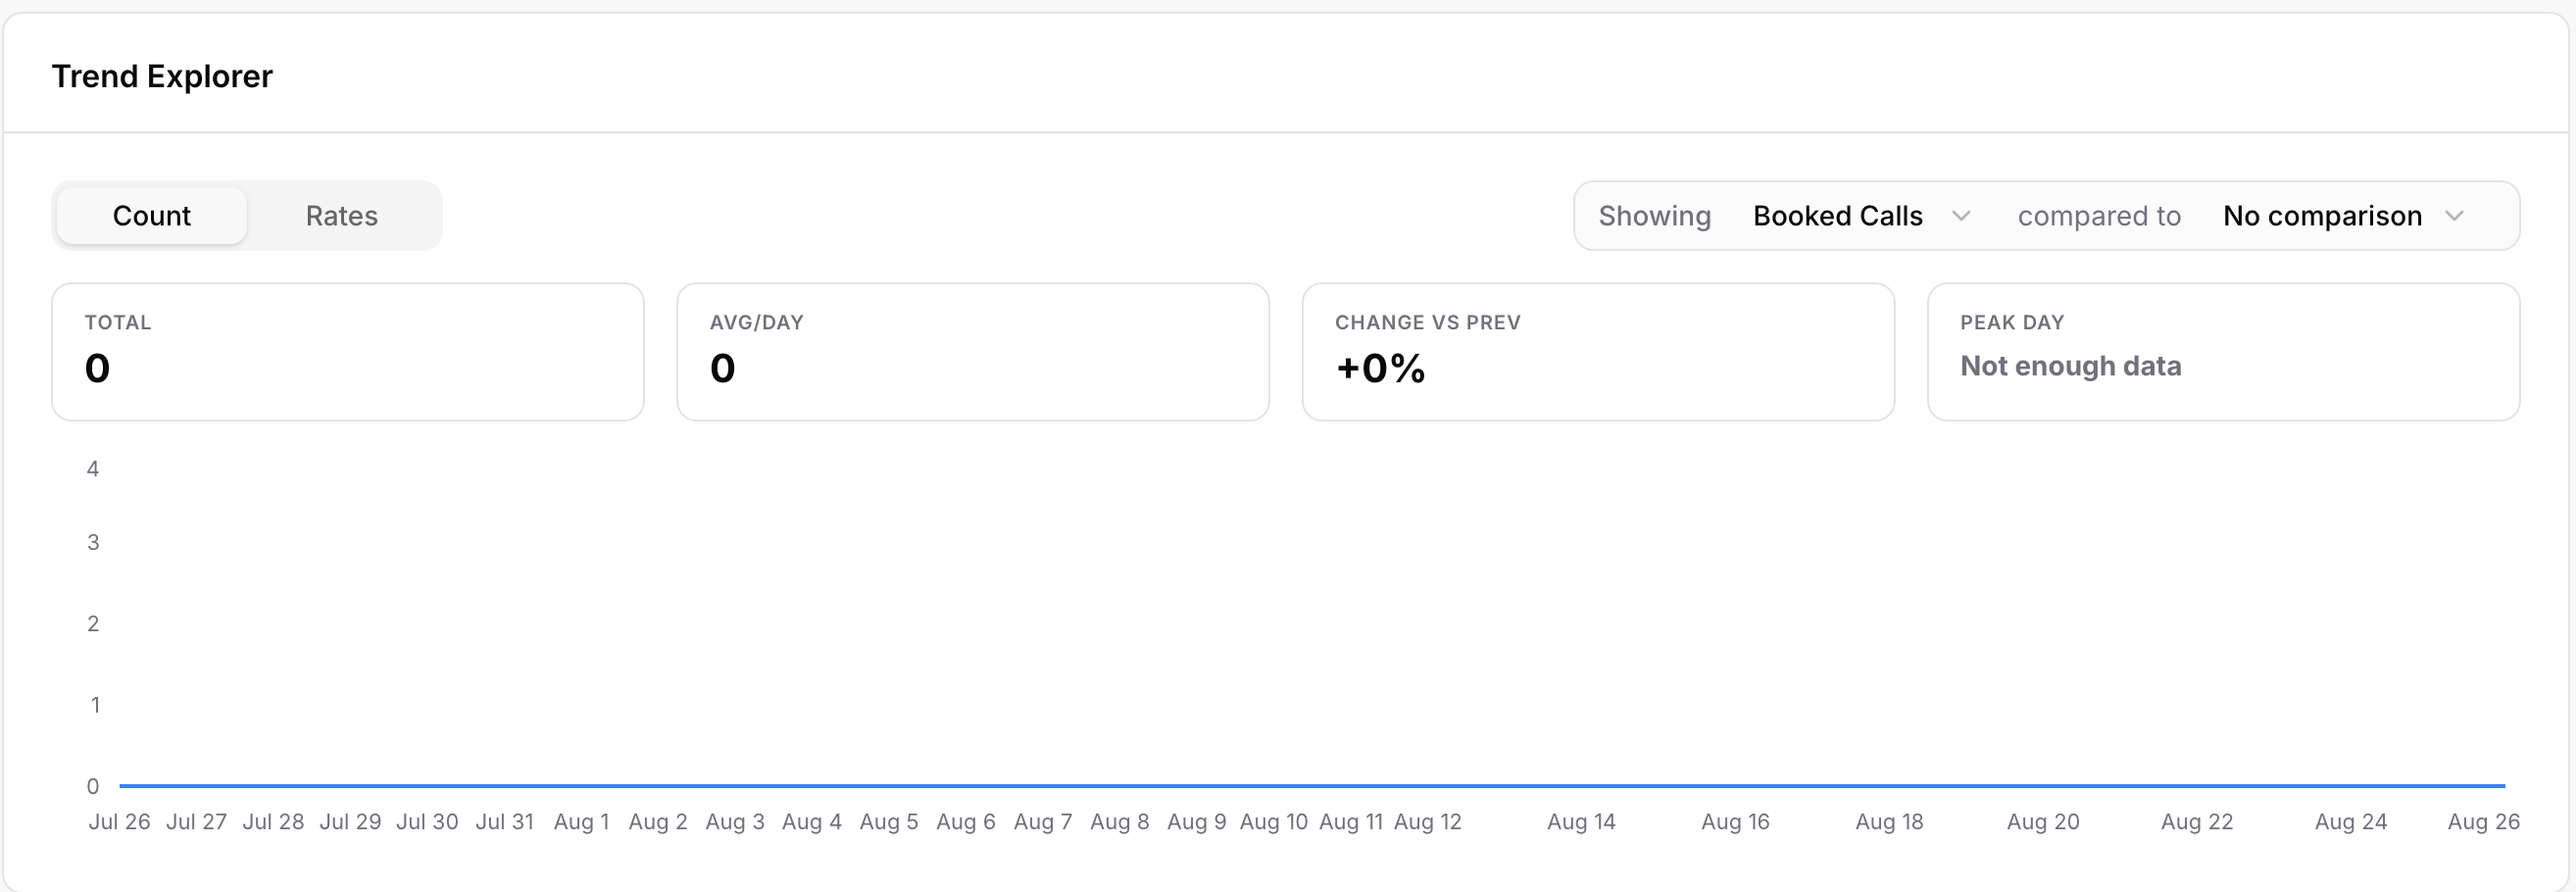
A daily chart of one metric at a time. Choose Count (Booked Calls, Leads, Qualified Leads, Completed Submissions, Unique Visitors) or Rates (Start Rate, Opt-in Rate, Qualification Rate, Booked Call Rate, Completion Rate), pick the metric under Showing, and optionally a second one under compared to to overlay both lines. The tiles above the chart give the Total, Avg/Day, Change vs Prev period, and the Peak Day. Hover any point for the exact value.
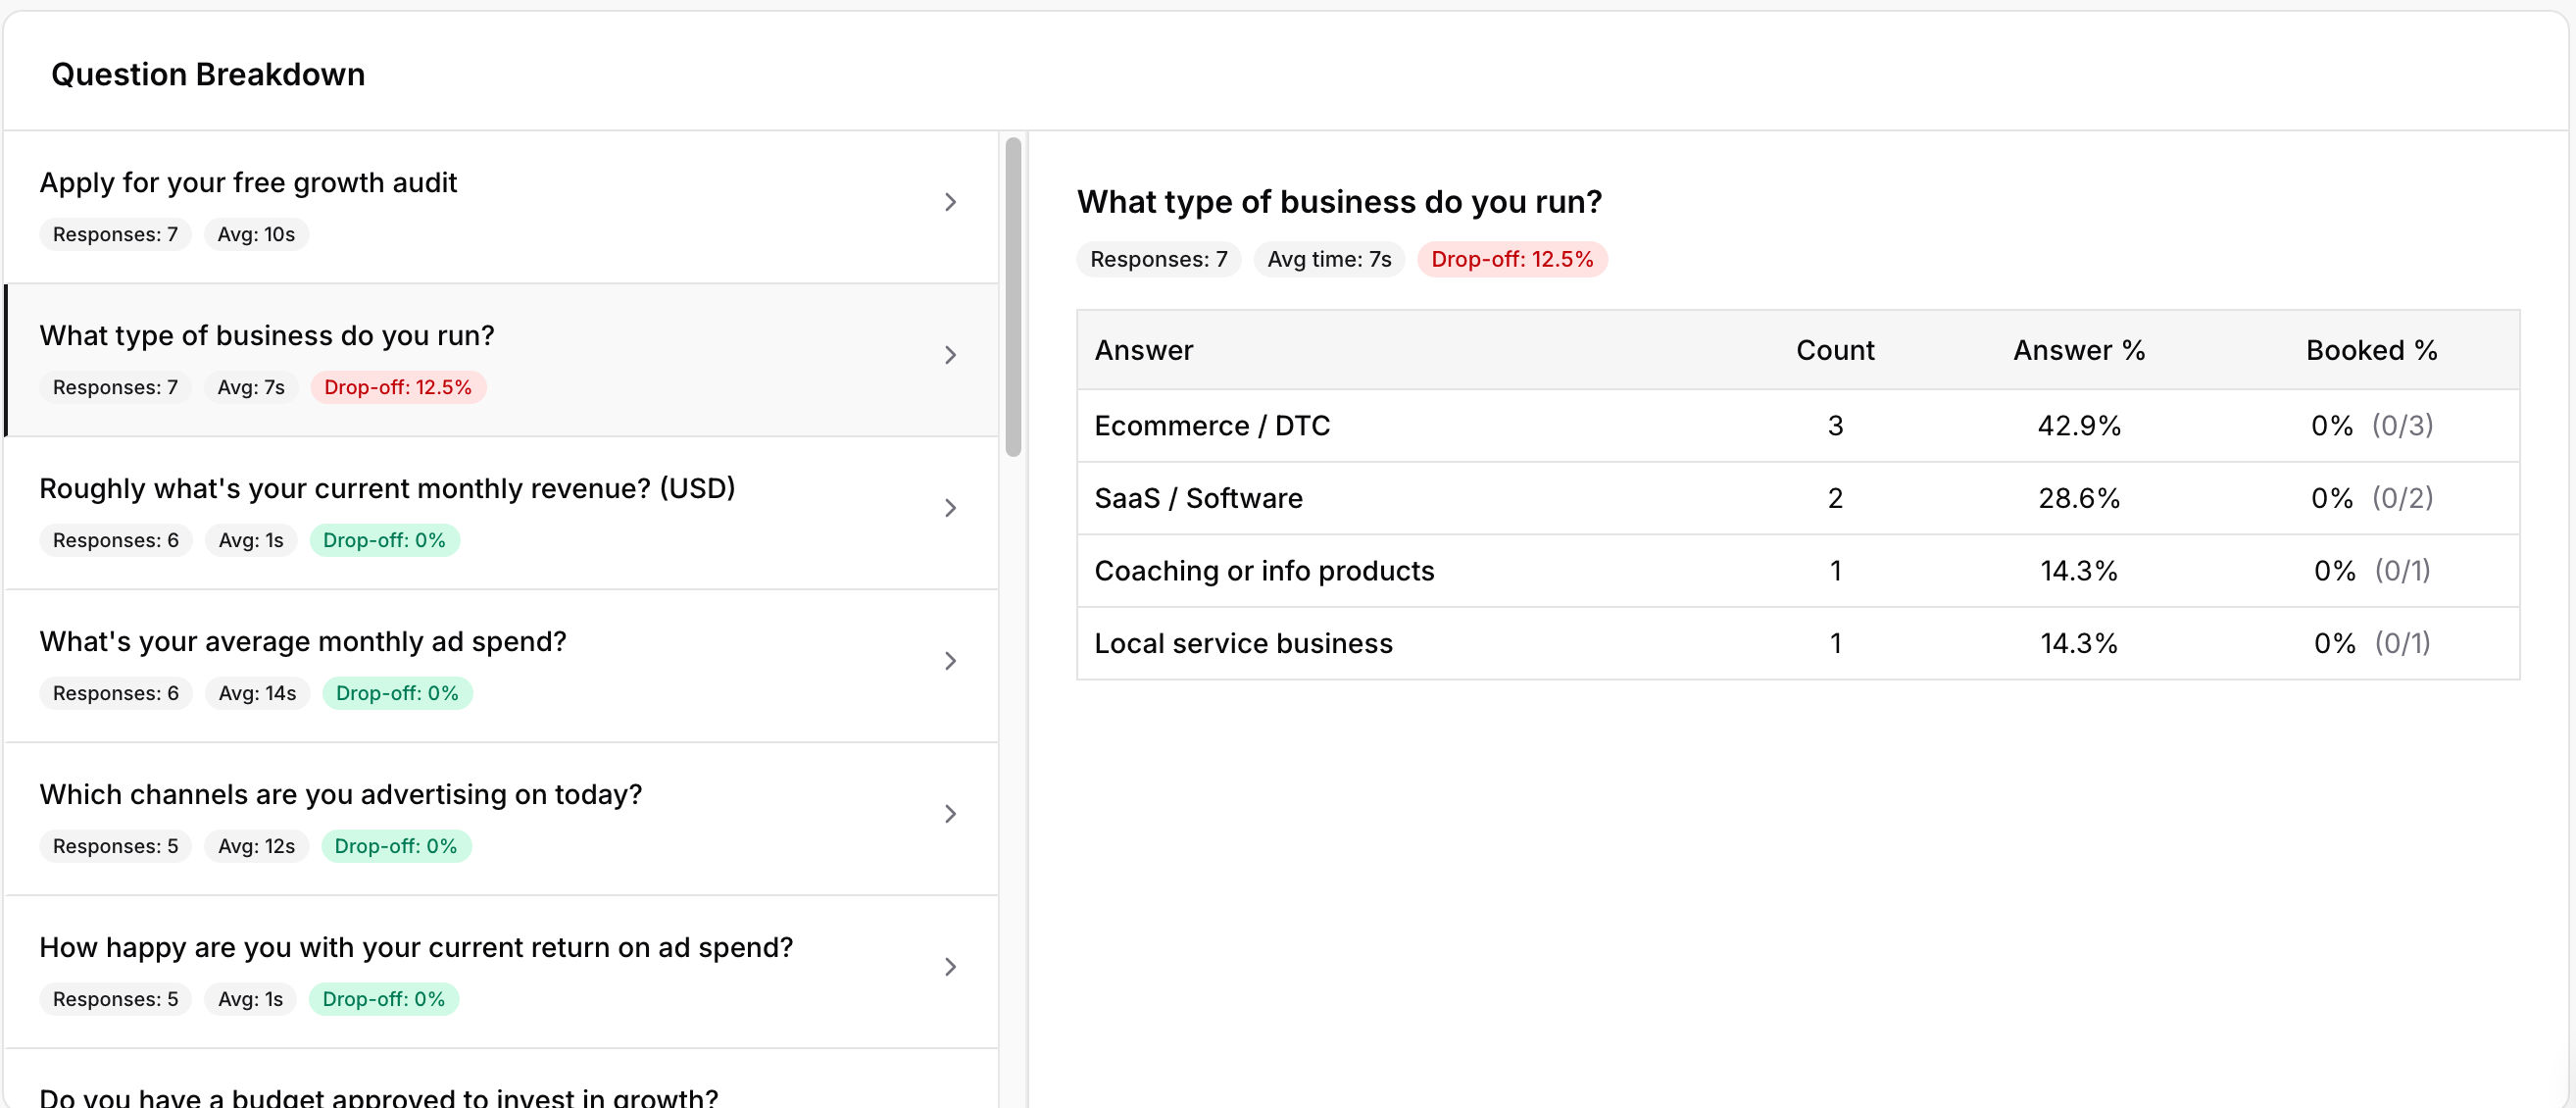
Every step of the form in order, each showing Responses (how many visitors reached it), Avg time spent on it, and Drop-off, the share of visitors who left the form at that step. A red drop-off badge is the question to look at first: it is too hard, too personal, or asked too early.
Click a question to see its answers on the right:
Choice questions show a table of each answer with Count, Answer % (share of responses), and Booked % (how many of the people who picked it went on to book, with the raw numbers). This is how you learn which answers predict a booked call.
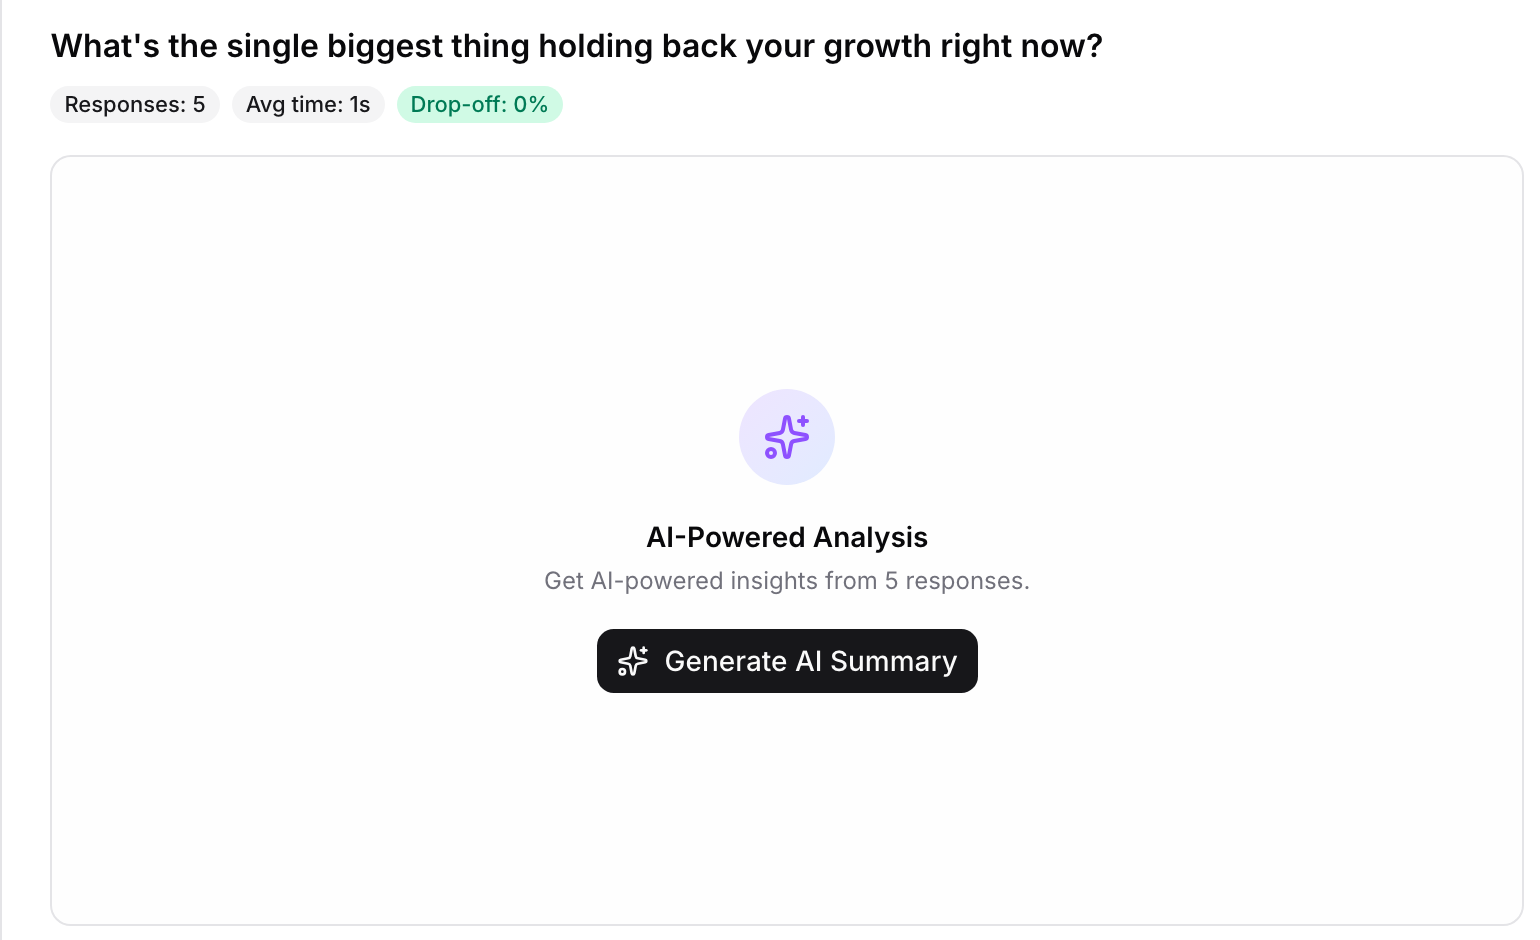
Text questions offer AI-Powered Analysis: click Generate AI Summary to get a short summary of the themes in the free-text answers instead of reading them one by one. It needs a handful of responses to work with.
Intro screens, content steps, and contact fields have no breakdown.
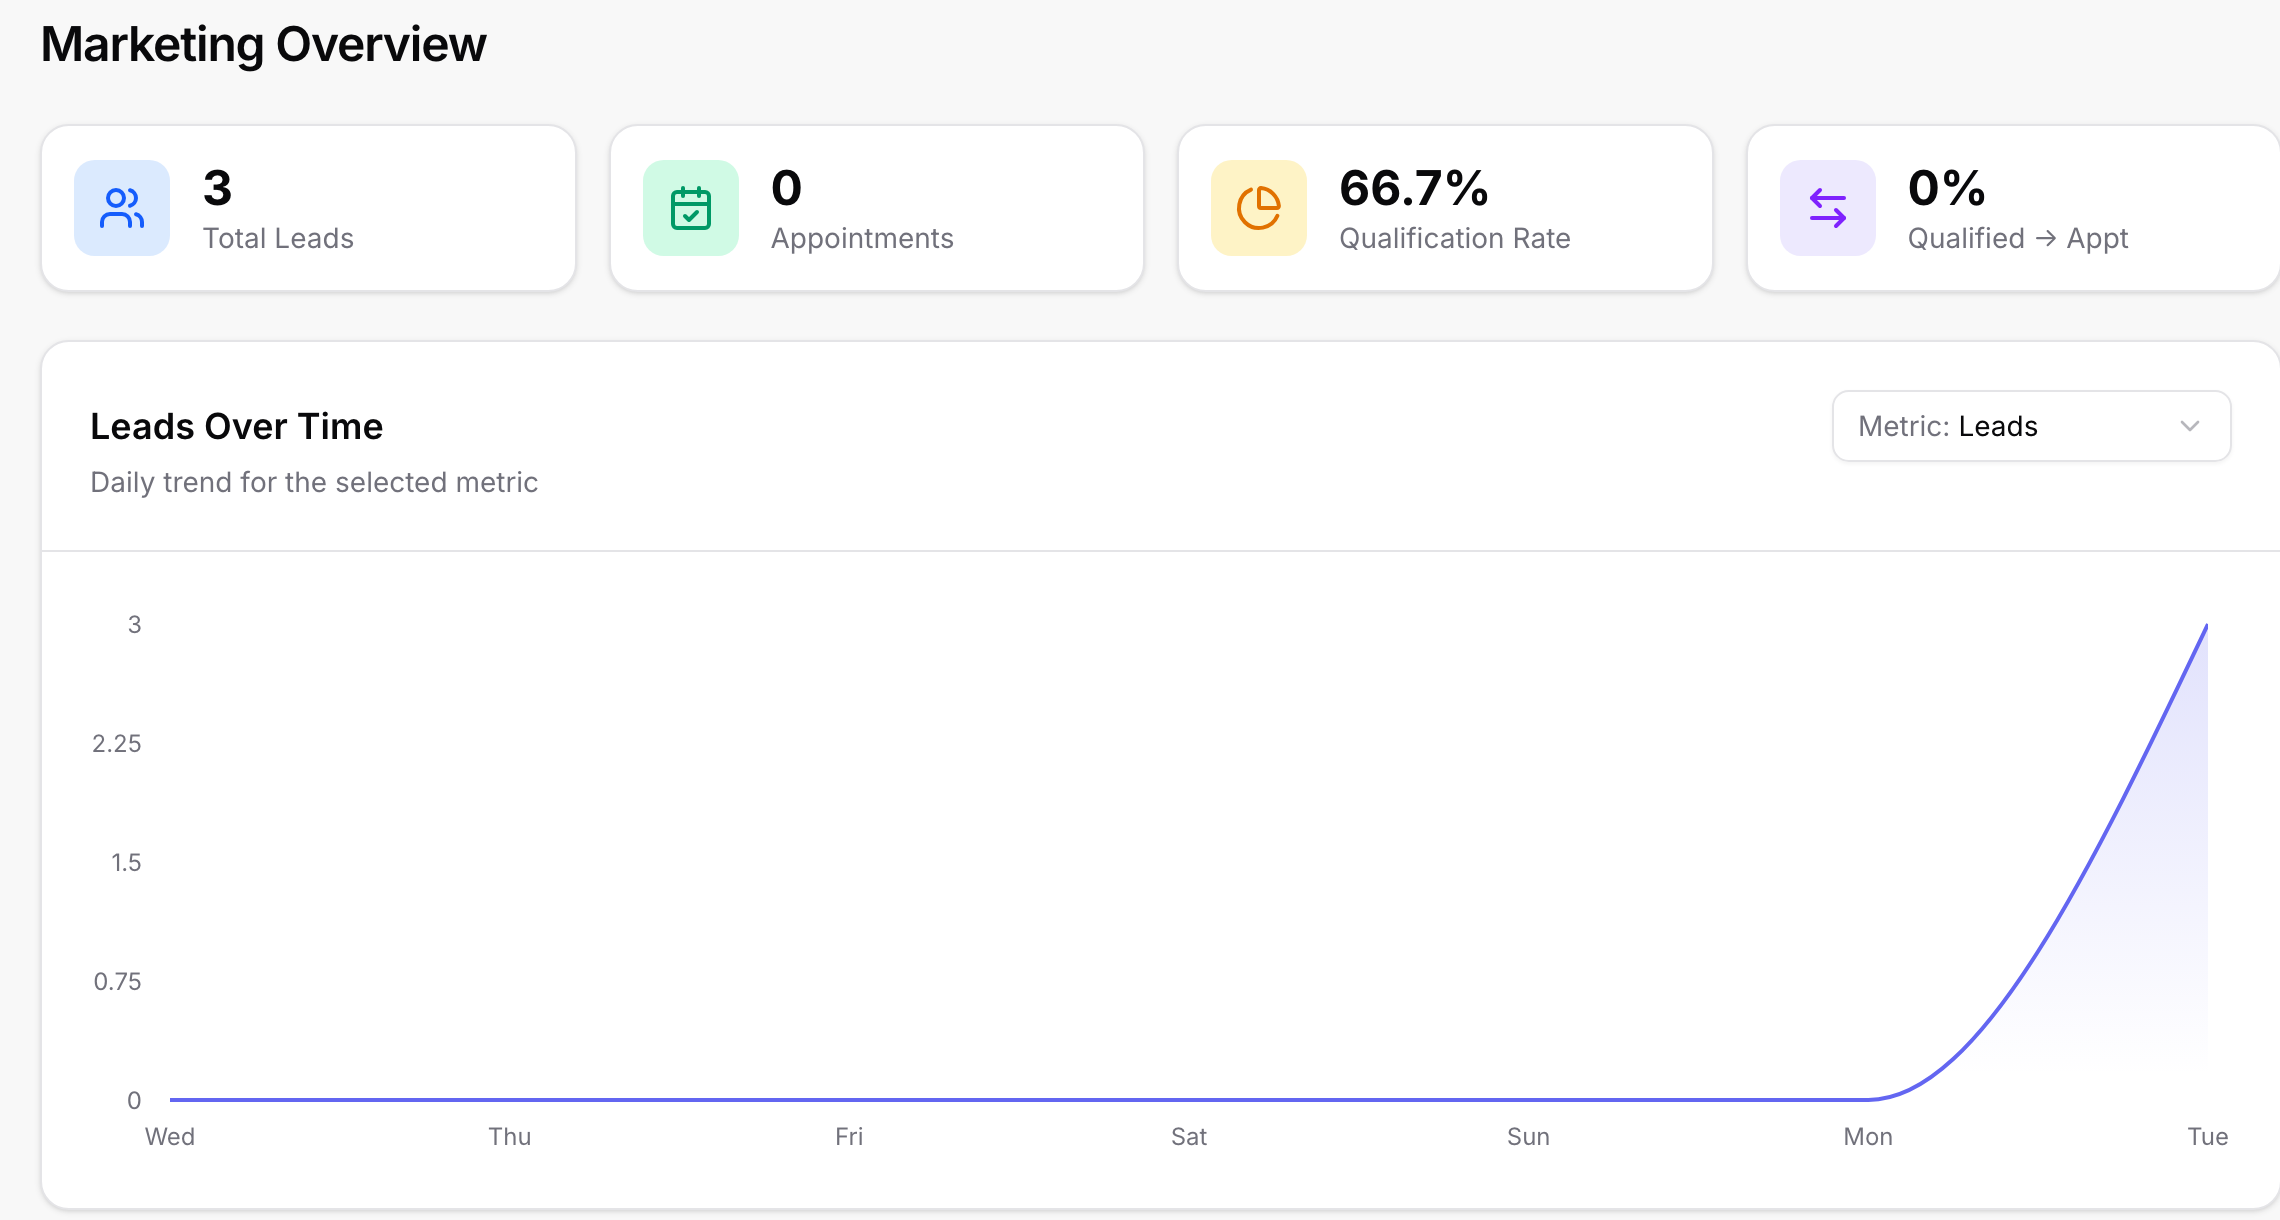
Dashboard in the sidebar rolls all forms in the subaccount into one Marketing Overview: Total Leads, Appointments, Qualification Rate, and Qualified to Appt rate, a Leads Over Time chart with a metric selector, Top Performing Forms ranked by lead volume and qualification rate, and Upcoming Appointments across every form.
A view is recorded every time the form loads. Unique Visitors counts distinct visitors, identified by IP address plus browser; the same person on two devices is two visitors.
A start is recorded when a visitor begins the form (moves past the intro or answers the first question).
Leads counts distinct people who left an email or phone, including partial submissions. Completed counts leads with at least one complete submission, which is why Leads can be higher than Completed.
Opening your own form to test it counts like any visitor. Use the date range to look past your test day, or reset the form's stats before launch.
Every lead behind these numbers is a row in the Submissions tab, where you can filter by campaign, qualification, or status; see Managing Leads and Submissions.
A split test shows each variant's numbers on its own form's Analytics tab; the comparison lives on the split test page.
Need a clean slate after testing? You can reset a form's statistics; see the article on resetting form stats.

